


 It wasn’t until I got my first look in early May at our new custom metrics dashboard that I realized so many of my assumptions about who was contributing to our community news site were wrong.
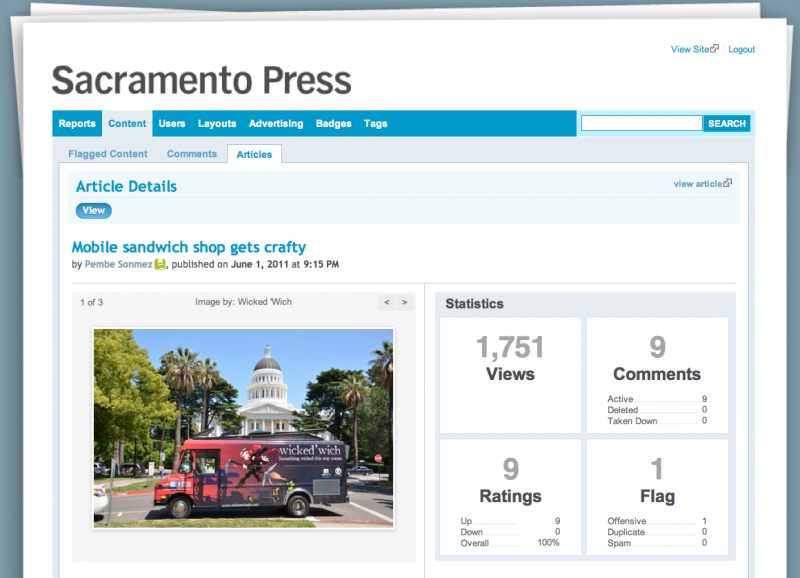
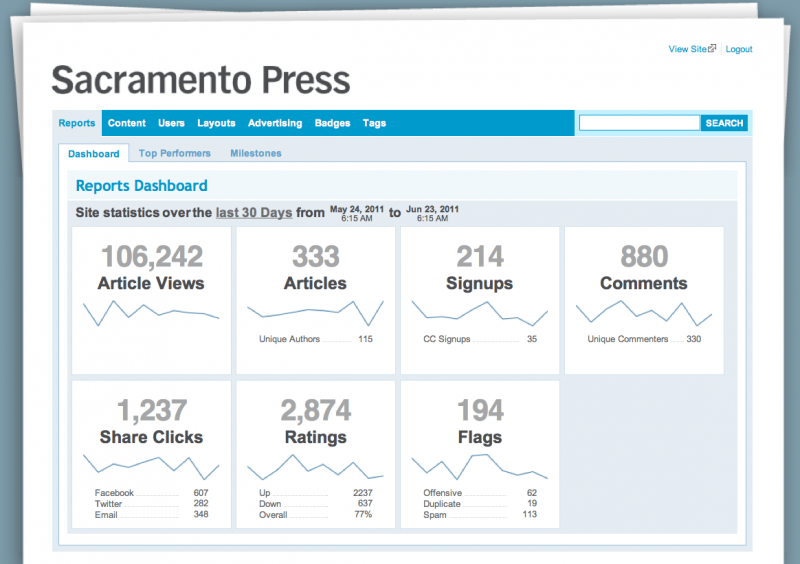
I had always thought there were only a handful of very active commenters. In fact, in the last 30 days, there have been 330 unique commenters. Likewise, I had figured there were maybe 25 unique authors a month. In the last 30 days there were 115.
I also learned that people are using our share buttons more than commenting. And spam is by far the site’s most troubling problem for our moderators.
We needed metrics that gave us more than the standard Google Analytics report that focuses on page views and the number of unique visitors.
When I changed the parameter of the questions to see what our metrics looked like since we launched in October 2008, I quickly discovered we had just topped 1,000 unique authors. Awesome!
At Sacramento Press, we may have a staff of 10, but we rely heavily on community contributions. We needed metrics that gave us more than the standard Google Analytics report that focuses on page views and the number of unique visitors.
So at Macer Media, Sacramento Press’s corporate parent, we came up with our own dashboard that gives us clear answers to the kinds of questions community-driven local news sites have. Answers that empower our staff to do their jobs better and understand our community better.
We want to create milestones that reflect our values.
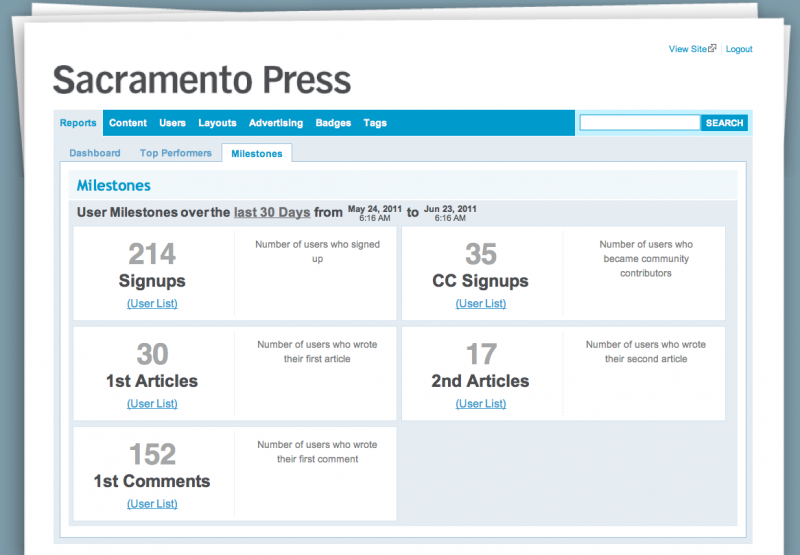
It not only lists site statistics, but also contributor statistics and milestones. We care about growing our community and activating them to take actions like commenting, writing articles, sharing articles and continuing to engage with each other over time. We want to create milestones that reflect our values.
I now use the dashboard every day to give me a site snapshot: What are the top performing authors and articles? What articles are driving traffic or being shared?
And our department heads, instead of hand counting a few metrics, have more numbers in context, faster. They can now spend time adjusting to the challenges that arise from the data.
For example, our director of community outreach saw that her efforts to engage the community and recruit authors was being eroded by time dealing with spam and missing conflict-of-interest disclosures from contributors writing stories about organizations with which they are affiliated.
One solution: our technology team is building a system for adding simple disclosures for our community contributors. We also altered our terms of use to require disclosures of affiliation.
Think about that. This is not a standard approach to increasing engagement, but will allow our outreach director to spend more time meeting potential new authors.
This likely would have happened without our great dashboard, but it would have happened in a very different way. Something would get to a crisis mode. Then I would try to hunt down why something was breaking and push our developers to install a quick fix ASAP.
The old way created stress and tension between departments as problems grew, unaddressed. Even worse, it made the organization unmanageable and thus unscalable.
Data sets are easy to export in the new system. For a metrics geek like me, the new dashboard allows me to take a deep dive into more whimsical questions.
About two weeks after the system was released, I started wondering if there were some useful patterns in the length of time between user sign-up and publication of the user’s second article. The results were not that interesting, but when I applied the same analysis to the length of time between sign-up and first article publication I found really interesting trends.
For most authors, it takes between five and 20 minutes between initial sign-up and first article publication. This means two things. One, the article has already been written in a word processor. Two, our three-stage sign-up and article-writing process takes at least five minutes. That seems way too long. When was the last time you waded through a five-minute anything online?
This led us to consider such improvements as:
- a streamlined sign-up process for people who want to immediately publish.
- a small message asking if the author would like to take advantage of free copy editing before rushing to publish.
- .doc and .rtf file uploads to publish.
The Sacramento Press is a laboratory. We are experimenting and iterating how to create a useful community resource for news on- and off-line.
The Sacramento Press is a laboratory. We are experimenting and iterating how to create a useful community resource for news on- and off-line.
As COO I am in charge of this experiment. In the last two and a half years we have grown from three people to 10. In addition, we have a technical team, a digital marketing agency, and we run two advertising networks. I have also been traveling to attend more conferences and find strategic partners. My job got harder.
I needed to keep contact with department heads. More important, the department heads needed to know what each other was doing. I started a monthly meeting for all of us. I also asked each department head to start tracking metrics that might help guide their decision-making. They worked with CFO Anil Sinha to identify useful metrics.
Often these numbers were tough to come by. For example, our outreach director Casey Kirk wanted to know how many people wrote their first article on our site. She also wanted to know how many people wrote their second article.
Editor in chief David Watts Barton wanted to know whose stories were shared the most, viewed the most and commented on the most in the last month.
So Geoff Samek, our VP of Product, worked over many months to design an elegant solution that integrated our own data with the Google Analytics API to answer the questions our organization regularly asks. The resulting dashboard display the answers in a simply, easy format rather than via confusing tables and charts.
For now, the dashboard is only usable on Sacramento Press’s custom CMS.
Ben Ilfeld is Chief Operating Officer of the Sacramento Press.


Comments are closed.